原文地址:https://vladmihalcea.com/postgresql-plan-cache-mode/
本文阐述了PostgreSQL对于prepared statement预处理语句生成执行计划的规则,原文中并没有提及测试环境的PostgreSQL版本,笔者在PostgreSQL 16下测试,遇到了一些与原文不一致的地方,文末有详细的测试和验证。
以下为译文。
您是否正在为Spring、Jakarta EE或Java EE应用的性能问题所困扰?
想象一下,如果有款工具能自动检测JPA和Hibernate数据访问层的性能瓶颈根源,会怎样?
若能在开发阶段就借助这样的工具监控应用性能,在问题影响生产系统之前防患于未然,岂非绝佳之选?
Hypersistence Optimizer(译者注:原文作者推广的一款插件)正是这样的神器!它完美兼容Spring Boot、Spring Framework、Jakarta EE、Java EE、Quarkus、Micronaut及Play Framework。
与其在周六深夜紧急修复生产系统性能问题,不如使用Hypersistence Optimizer主动预防隐患,把宝贵时间留给真正热爱的事物!
Introduction
在本文中,我们将深入分析PostgreSQL的plan_cache_mode配置参数,并探讨何时适合采用force_custom_plan策略来替换generic plan通用执行计划。
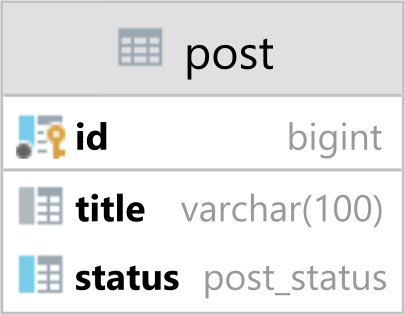
Domain Model
我们假设有如下一个表结构
其中post_status 字段是一个如下的枚举类型:
CREATE TYPE post_status AS ENUM (
'PENDING',
'APPROVED',
'SPAM'
)
假设该表中中有10万条贴文记录,但这些记录的status状态值分布极不均匀(存在严重的数据倾斜)。
例如,执行如下查询
SELECT
    a.*,
    matching_records::float/row_count AS selectivity
FROM (
     SELECT
         status,
         COUNT(<em>) AS matching_records
     FROM post
     GROUP BY status
) a
CROSS JOIN LATERAL (
    SELECT COUNT(</em>) AS row_count
    FROM post
) b
ORDER BY selectivity DESC
可以得到如下结果:
| status | matching_records | selectivity |

| -------- | ---------------- | ----------- |

| APPROVED | 95000 | 0.95 |

| PENDING | 4000 | 0.04 |

| SPAM | 1000 | 0.01 |
95% 的帖子是APPROVED状态.
4% 的帖子是PENDING状态.
1% 的帖子是spam状态.
基于status字段的筛选 Filtering by status
现在有基于status字段的这么一个查询,如下:
SELECT id, title, status
FROM post
WHERE status = ?为了避免全表扫描,大多数情况下,你可能会想到在status字段上创建一个如下的索引CREATE INDEX idx_post_status ON post (status)
尽管如此,基于status字段的索引的选择性(selectivity),上面的查询的执行的时候,PostgreSQL不一定会用到idx_post_status这个索引
case 1
比如,当用status为PENDING为过滤条件的时候,PostgreSQL的执行计划如下
Bitmap Heap Scan on post
  (cost=46.44..1231.07 rows=3890 width=57)
  (actual time=0.233..1.132 rows=4000 loops=1)
  Recheck Cond: (status = 'PENDING'::post_status)
  Heap Blocks: exact=46
  ->  Bitmap Index Scan on idx_post_status
        (cost=0.00..45.47 rows=3890 width=0)
        (actual time=0.211..0.212 rows=4000 loops=1)
        Index Cond: (status = 'PENDING'::post_status)
执行计划首先扫描idx_post_status索引,然后通过bitmap在内存页面中标记处目标数据库所在的数据页,随后,位图堆扫描(Bitmap Heap Scan) 会根据位图中的页面标识符,到 post 表的数据页中定位具体记录。
case 2
当根据status字段为SPAM的条件过滤的时候,PostgreSQL将会使用index scan替代bitmap index scan。
Index Scan using idx_post_status on post
  (cost=0.29..1089.83 rows=963 width=57)
  (actual time=0.059..0.500 rows=1000 loops=1)
      Index Cond: (status = 'SPAM'::post_status)
case 3
然而,如果我们通过status为APPROVED的条件进行过滤,PostgreSQL将会忽略idx_post_status索引,并在Post表上使用full-table scan。
Seq Scan on post
  (cost=0.00..2386.00 rows=95147 width=57)
  (actual time=0.034..36.765 rows=95000 loops=1)
      Filter: (status = 'APPROVED'::post_status)
      Rows Removed by Filter: 5000
当需要扫描表中 95% 的数据时,使用索引的成本反而远高于全表扫描, 这就是为什么按 APPROVED 状态过滤时会选择顺序扫描。
正如前文中所述,由于状态值分布极不均匀,我们只需为选择性高的值(如 PENDING 和 SPAM)建立索引才具有实际意义。
因此,既然 idx_post_status 索引无法用于 APPROVED 状态值,我们可以将其修改为排除 APPROVED值的部分索引:CREATE INDEX idx_post_status ON post (status) WHERE (status <> 'APPROVED')
默认的PostgreSQL plan_cache_mode
正如在这篇文章里提到的,PostgreSQL对于预处理语句(prepared statement),执行的前4次,生成定制化执行计划(custom execution plan)。从第5次开始,PostgreSQL将会生成一个通用执行计划(generic plan)来替代定制化执行计划。
译者注:这里并不清楚原文作者测试的PostgreSQL版本,测试中提到“前4次执行并未在服务器端预编译,从第5次开始,预处理语句就使用了在当前连接期间缓存的通用执行计划。”具体换成哪种执行计划,这一点于笔者在PostgreSQL 16中的测试并不相符,详见本文末尾的测试。
我们可以使用如下的测试案例来验证这种行为:
executeStatement(
    connection,
    "LOAD 'auto_explain'",
    "SET auto_explain.log_analyze=true",
    "SET auto_explain.log_min_duration=0"
);
LOGGER.info(
    "Plan cache mode: {}",
    selectColumn(
        connection,
        "SHOW plan_cache_mode",
        String.class
    )
);
try (PreparedStatement statement = connection.prepareStatement("""
        SELECT id, title, status
        FROM post
        WHERE status = ?
        """)) {
    for (int i = 1; i <= 10; i++) {
        executeStatementWithStatus(statement, PostStatus.APPROVED);
    }
    executeStatementWithStatus(statement, PostStatus.SPAM);
}
如下,executeStatementWithStatus方法是一个工具方法,用于执行指定状态值的预处理语句(PreparedStatement):
protected int executeStatementWithStatus(
        PreparedStatement statement,
        PostStatus status) throws SQLException {
    LOGGER.info(
        "Statement is {}prepared on the server",
        PostgreSQLQueries.isUseServerPrepare(statement) ?
            "" :
            "not "
    );
    int rowCount = 0;
    statement.setObject(
        1,
        PostgreSQLQueries.toEnum(status, "post_status"),
        Types.OTHER
    );
    try(ResultSet resultSet = statement.executeQuery()) {
        while (resultSet.next()) {
            rowCount++;
        }
    }
    return rowCount;
}
该测试用例执行以下步骤:
首先,打印plan_cache_mode设置的默认值
接着,使用APPROVED状态值执行预处理语句10次
最后,再使用SPAM状态值执行一次预处理语句
Plan cache mode: auto

Statement is not prepared on the server
Time:127,
Query:["
SELECT id, title, status
FROM post
WHERE status = ?
"],
Params:[(APPROVED)]

Statement is not prepared on the server
Time:124,
Query:["
SELECT id, title, status
FROM post
WHERE status = ?
"],
Params:[(APPROVED)]

Statement is not prepared on the server
Time:128,
Query:["
SELECT id, title, status
FROM post
WHERE status = ?
"],
Params:[(APPROVED)]

Statement is not prepared on the server
Time:116,
Query:["
SELECT id, title, status
FROM post
WHERE status = ?
"],
Params:[(APPROVED)]

Statement is prepared on the server
Time:100,
Query:["
SELECT id, title, status
FROM post
WHERE status = ?
"],
Params:[(APPROVED)]

Statement is prepared on the server
Time:137,
Query:["
SELECT id, title, status
FROM post
WHERE status = ?
"],
Params:[(APPROVED)]

...

Statement is prepared on the server
Time:93,
Query:["
SELECT id, title, status
FROM post
WHERE status = ?
"],
Params:[(APPROVED)]

Statement is prepared on the server
Time:22,
Query:["
SELECT id, title, status
FROM post
WHERE status = ?
"],
Params:[(SPAM)]
可以看到,前4次执行并未在服务器端预编译,从第5次开始,预处理语句就使用了在当前连接期间缓存的通用执行计划。
观察Time部分可以发现:
使用APPROVED绑定参数值时,执行时间在93到137毫秒之间
而使用SPAM绑定参数值时,执行时间为22毫秒(对于获取1000条记录来说,这个耗时仍然偏高)
如果观察PostgreSQL的log,可以看到如下日志:
LOG:  duration: 124.261 ms  plan:
    Query Text: SELECT id, title, status
    FROM post
    WHERE status = $1

    Seq Scan on post
      (cost=0.00..2386.00 rows=94997 width=57)
      (actual time=0.040..29.204 rows=95000 loops=1)
      Filter: (status = 'APPROVED'::post_status)
      Rows Removed by Filter: 5000
LOG:  duration: 122.864 ms  plan:
    Query Text: SELECT id, title, status
    FROM post
    WHERE status = $1

    Seq Scan on post
      (cost=0.00..2386.00 rows=94997 width=57)
      (actual time=0.020..23.542 rows=95000 loops=1)
      Filter: (status = 'APPROVED'::post_status)
      Rows Removed by Filter: 5000
LOG:  duration: 127.540 ms  plan:
    Query Text: SELECT id, title, status
    FROM post
    WHERE status = $1

    Seq Scan on post
      (cost=0.00..2386.00 rows=94997 width=57)
      (actual time=0.024..24.103 rows=95000 loops=1)
      Filter: (status = 'APPROVED'::post_status)
      Rows Removed by Filter: 5000
LOG:  duration: 114.467 ms  plan:
    Query Text: SELECT id, title, status
    FROM post
    WHERE status = $1

    Seq Scan on post
      (cost=0.00..2386.00 rows=94997 width=57)
      (actual time=0.030..21.212 rows=95000 loops=1)
      Filter: (status = 'APPROVED'::post_status)
      Rows Removed by Filter: 5000
LOG:  duration: 100.076 ms  plan:
    Query Text: SELECT id, title, status
    FROM post
    WHERE status = $1

    Seq Scan on post
      (cost=0.00..2386.00 rows=94997 width=57)
      (actual time=0.021..18.262 rows=95000 loops=1)
      Filter: (status = 'APPROVED'::post_status)
      Rows Removed by Filter: 5000
LOG:  duration: 136.927 ms  plan:
    Query Text: SELECT id, title, status
    FROM post
    WHERE status = $1

    Seq Scan on post
      (cost=0.00..2386.00 rows=94997 width=57)
      (actual time=0.049..26.003 rows=95000 loops=1)
      Filter: (status = 'APPROVED'::post_status)
      Rows Removed by Filter: 5000

...

LOG:  duration: 93.088 ms  plan:
    Query Text: SELECT id, title, status
    FROM post
    WHERE status = $1

    Seq Scan on post
      (cost=0.00..2386.00 rows=33333 width=57)
      (actual time=0.021..17.735 rows=95000 loops=1)
      Filter: (status = $1)
      Rows Removed by Filter: 5000
LOG:  duration: 21.263 ms  plan:
    Query Text: SELECT id, title, status
    FROM post
    WHERE status = $1

    Seq Scan on post
      (cost=0.00..2386.00 rows=33333 width=57)
      (actual time=19.982..20.207 rows=1000 loops=1)
      Filter: (status = $1)
      Rows Removed by Filter: 99000
由于从第5次执行开始就采用了通用执行计划,导致即使用SPAM作为参数值,系统也进行了全表扫描(sequential scan)而非使用idx_post_status索引。
从最后一次查询的执行计划中的 “Rows Removed by Filter: 99000” 部分可以看出:PostgreSQL 扫描了 10 万条记录,结果却过滤丢弃了其中 99% 的数据。
使用plan_cache_mode的force_custom_plan 选项
PostgreSQL 官方文档指出,如果我们不希望复用通用执行计划,可以将plan_cache_mode参数设置为force_custom_plan选项。
启用 force_custom_plan选项后,PostgreSQL在执行预处理语句时将始终生成定制执行计划。
举例来说,如果在执行使用 SPAM 参数值的预处理语句前设置该选项:
try (PreparedStatement statement = connection.prepareStatement("""
        SELECT id, title, status
        FROM post
        WHERE status = ?
        """)) {
    for (int i = 1; i <= 5; i++) {
        executeStatementWithStatus(statement, PostStatus.APPROVED);
    }
    executeStatementWithStatus(statement, PostStatus.SPAM);
    executeStatement(
        connection,
        "SET plan_cache_mode=force_custom_plan"
    );
    executeStatementWithStatus(statement, PostStatus.SPAM);
}
可以看到,在设置 force_custom_plan 选项后,查询执行速度明显提升。Time:19,
Query:["
SELECT id, title, status
FROM post
WHERE status = ?
"],
Params:[(SPAM)]
SET plan_cache_mode=force_custom_plan
Time:2,
Query:["
SELECT id, title, status
FROM post
WHERE status = ?
"],
Params:[(SPAM)]
若检查数据库查询日志,我们会发现:启用force_custom_plan后,PostgreSQL将跳过通用执行计划,转而生成能充分利用idx_post_status索引的新执行计划:
OG:  duration: 18.290 ms  plan:
    Query Text: SELECT id, title, status
    FROM post
    WHERE status = $1

    Seq Scan on post
      (cost=0.00..2386.00 rows=33333 width=57)
      (actual time=17.012..17.215 rows=1000 loops=1)
      Filter: (status = $1)
      Rows Removed by Filter: 99000

LOG:  duration: 1.443 ms  plan:
    Query Text: SELECT id, title, status
    FROM post
    WHERE status = $1

    Bitmap Heap Scan on post
      (cost=16.37..1187.67 rows=1043 width=57)
      (actual time=0.146..0.306 rows=1000 loops=1)
      Recheck Cond: (status = 'SPAM'::post_status)
      Heap Blocks: exact=13
      ->  Bitmap Index Scan on idx_post_status
            (cost=0.00..16.11 rows=1043 width=0)
            (actual time=0.142..0.142 rows=1000 loops=1)
            Index Cond: (status = 'SPAM'::post_status)
太棒了,对吧?
结论
当执行预处理语句时,PostgreSQL 可能采用定制执行计划(custom plan)或通用执行计划(generic plan)。
若发现 PostgreSQL 选择的通用执行计划不适用于当前绑定参数值,则可采用 force_custom_plan 策略,强制 PostgreSQL 跳过通用计划,改为每次查询都生成定制执行计划。
笔者验证测试于脚本
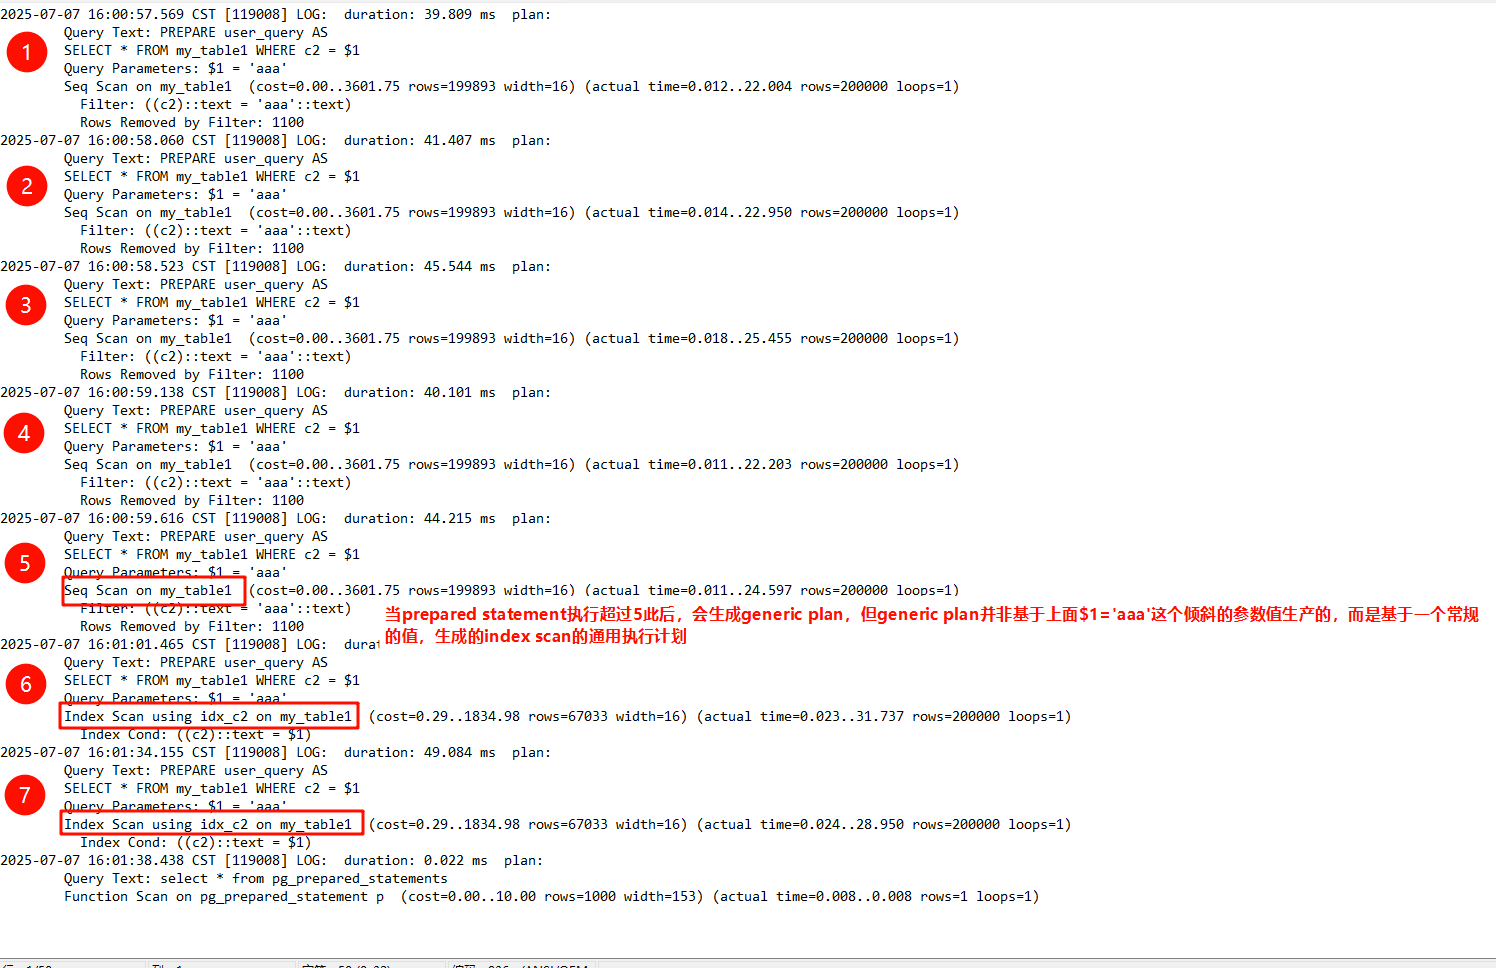
文中并没有提及测试环境的PostgreSQL版本,笔者在PostgreSQL 16下测试,遇到了一些与原文不一致的地方,也就是说,在预处理语句会针对不同的参数值生成不同的执行计划,执行超过5次之后,会生成通用执行计划,但是该通用执行计划并不是非常规参数的值对应的执行计划,而是基于一个常规值,比如前5次用一个分布站总行数95%的值做查询,执行计划是seq table scan, 最后生成generic plan的时候,并非基于该倾斜值生成的,而是基于一个一般值,生成一个index scan的执行计划缓存。
笔者的测试环境是PostgreSQL 16,于原文中的测试有一些出入,总结起来就是:PostgreSQL在为prepared statement生成执行generic plan计划的时候,并不会为倾斜值(分布多,唯一性很低,默认情况下会做seq scan)生成执行计划,而是基于一个常规值生成执行计划(常规值是唯一性高,选择性高),优化器尝试缓存一个更为适合“普通”参数值的执行计划,而不是为一个选择性很低的值缓存执行计划,这一点可以认为是PostgreSQL改进的一个特性。其实很明显还是会存在问题,生成的generic plan并不适合当前这个倾斜值很高的参数的执行计划。所以,特殊情况下,该考虑plan_cache_mode在默认的auto情况下是否是最佳实践,是否该考虑使用force_custom_plan参数。
select * from pg_settings where name like '%plan_cache_mode%';
plan_cache_mode有三个值
1,auto,默认值为auto,预处理语句会针对不同的参数值生成不同的执行计划,执行超过5次之后,会生成通用执行计划,
但是该通用执行计划并不是非常规参数的值对应的执行计划,而是基于一个常规值,比如前5次用一个分布站总行数95%的值做查询,执行计划是seq table scan,
最后生成generic plan的时候,并非基于该倾斜值生成的,而是基于一个一般值,生成一个index scan的执行计划缓存
2,force_generic_plan,会生成一个常规参数的执行计划,并非基于第一次参数的执行计划,优点是是可以避免频繁的sql编译,缺点是可能会导致部分sql以非最优化的方式执行
3,force_custom_plan,每次都根据参数值编译一个执行计划,优缺点与2中提到的相反。
create table my_table1
(
c1 int GENERATED BY DEFAULT AS IDENTITY,
c2 varchar(100),
c3 timestamp
);
insert into my_table1(c2,c3)
select 'aaa',now() from generate_series(1,100000);
insert into my_table1(c2,c3)
select 'bbb',now() from generate_series(1,1000);
insert into my_table1(c2,c3)
select 'ccc',now() from generate_series(1,100);
create index idx_c2 on my_table1(c2);
-- 模拟prepared statement的语句
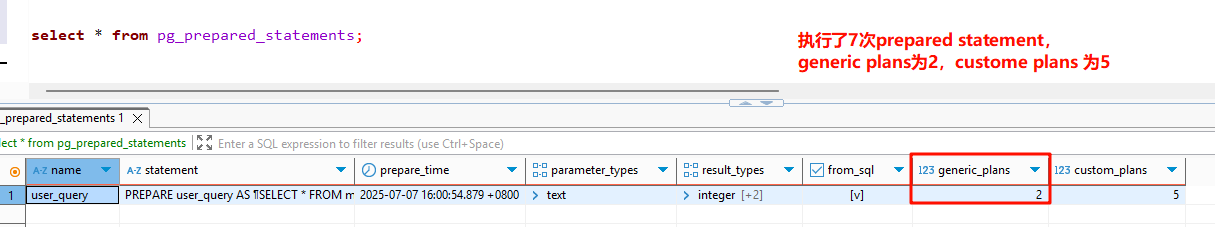
select * from pg_prepared_statements;
name|statement|prepare_time|parameter_types|result_types|from_sql|generic_plans|custom_plans|
----+---------+------------+---------------+------------+--------+-------------+------------+
LOAD 'auto_explain';
SET auto_explain.log_analyze=true;
SET auto_explain.log_min_duration=0;
-- 准备语句(使用 $1 作为参数占位符)
PREPARE user_query AS
SELECT * FROM my_table1 WHERE c2 = $1;
-- 执行预处理语句(传递实际参数),此时如果执行超过4次,第5次开始生成一个generic_plans,但是这个generic_plans并不是基于分布验证倾斜的aaa的值生成的,而是基于一个一般值生成的
EXECUTE user_query ('aaa');
-- 执行预处理语句(传递实际参数)
EXECUTE user_query ('ccc');
-- 查询预处理语句的执行计划
explain
EXECUTE user_query ('ccc');
-- 查询预处理语句generic plan的执行计划,PostgreSQL 16新特性
explain (generic_plan)
EXECUTE user_query ('ccc');
select * from pg_prepared_statements;
name |statement |prepare_time |parameter_types|result_types |from_sql|generic_plans|custom_plans|
----------+------------------------------------------------------------+-----------------------------+---------------+-----------------------------------------------------------+--------+-------------+------------+
user_query|PREPARE user_query AS ¶SELECT * FROM my_table1 WHERE c2 = $1|2025-07-07 14:27:01.737 +0800|{text} |{integer,"character varying","timestamp without time zone"}|true | 0| 2|
DEALLOCATE user_query;